
THE LATEST
-

Friday morning fatal crash causes SR 18 closure in both directions
-
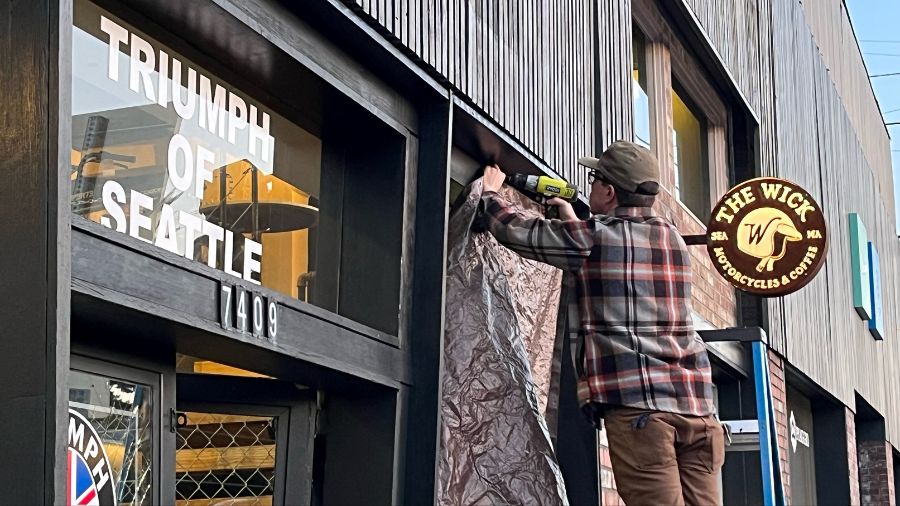
Break-in of North Seattle motorcycle dealership causes heavy damage
-

Spike O’Neill: Why Seattle’s new art space won’t work
-

King County Public Health monitoring potential measles case
-

Annual Washington Coast Cleanup looking for volunteers ahead of Earth Day
-

Trader Joe’s recall: Salmonella found in basil


LISTEN NOW: LIVE RADIO


QUESTION OF THE DAY
MyNorthwest News
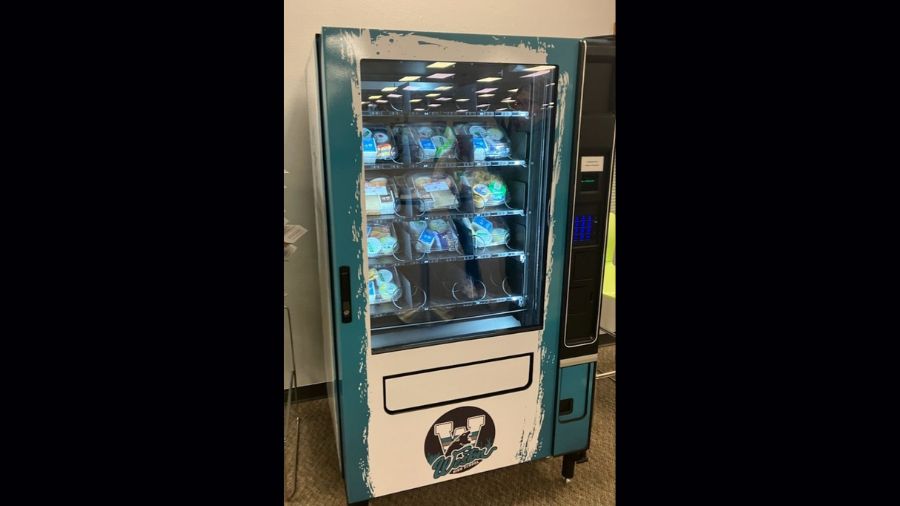
Arlington school breaks barriers one vending machine meal at a time
Weston High School now offers a vending machine with free breakfast or lunch for students who miss a meal.

Seattle Storm unveil new Interbay practice facility, alternative uniforms
SEATTLE (AP) — Alisha Valavanis walked around as the new performance center for the Seattle Storm was unveiled on Thursday filled mostly with joy and a little sadness. The joy for the CEO of the Storm — who has been with the team for nearly a decade — came from helping bring to completion the […]

'What'd you say?': Starbucks attempts to tamp down the noise
The coffee retailer, Starbucks, aims to reduce noise levels and enhance accessibility through strategic changes.

Seattle Mayor to address city's arson problem in vacant buildings
Seattle Mayor Bruce Harrell has proposed emergency legislation to address the escalating issue of fires and arson in vacant buildings.

13-year-old Madison Valley girl missing since Tuesday
The Seattle Police Department (SPD) is asking the public to keep an eye out for a missing 13-year-old girl from Madison Valley.
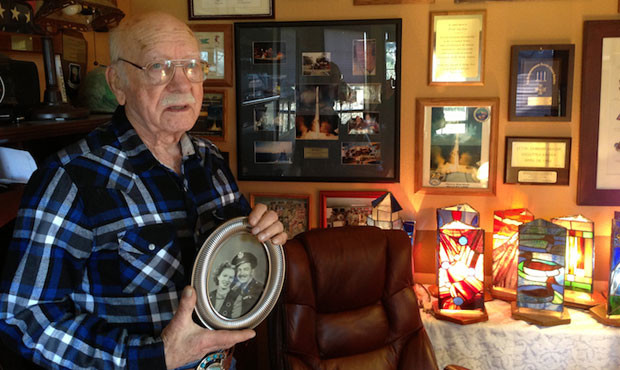
Remembering Enumclaw's Doolittle Raider Edward Saylor
Edward Saylor volunteered to be a flight engineer on the dangerous "Doolittle Raid" mission 75 years ago.
SeattleSports.com

Rost: The Seahawks’ smart pick, fun pick and wild card at No. 16
With less than a week until the Seattle Seahawks are on the clock in the NFL Draft at No. 16 overall, Stacy Rost looks at three directions they could go.

Kraken outlast Minnesota 4-3 to end third season in NHL
Tye Kartye tipped in the tiebreaking goal with 2:40 remaining, and the Seattle Kraken beat the Minnesota Wild 4-3 to wrap up the regular season for two teams that missed the playoffs.

Seahawks GM Schneider: How draft position impacts strategy
With Seattle Seahawks GM John Schneider owning the No. 16 pick, he shared some thoughts on how draft position impacts the strategy of trading back.

Seahawks GM Schneider addresses ‘picture gate’ at team HQ
Why did the Seattle Seahawks remove some pictures and slogans at team HQ from the Pete Carroll era? GM John Schneider has the story.

Video: John Schneider joins Wyman and Bob to talk about what goes into trading back in draft, “Picturegate”
Seahawks President of Football Operations John Schneider joined the Wyman & Bob show LIVE from the Seahawks headquarters to talk about the Seahawks off-season, what goes into trading back in the NFL Draft and what to make of “Picturegate”. Is there a bigger story to the pictures coming down at the VMAC? Watch the full […]

Bump: Why a Rashaad Penny reunion makes sense for Seahawks
The Seattle Seahawks reportedly met with free agent running back Rashaad Penny. Here's why it'd make sense for Seattle to bring him back.
KIRO Newsradio Opinion

Video of man getting knocked out, robbed in Seattle goes viral; Gee and Ursula respond
A disturbing video has gone viral of a man getting knocked out and robbed by a small group of people on Capitol Hill Sunday.

Angela Poe Russell: O.J.'s death reminds America of its persistent judicial problem
Most people who stand accused, regardless of guilt or innocence, can’t afford O.J.'s dream team of attorneys, much less standard fees.

Gee and Ursula: Did pro-Palestinian protesters lose supporters by blocking traffic?
46 pro-Palestinian demonstrators were arrested after blocking the expressway leading to Sea–Tac. Gee Scott says that's when they lost him.
KTTH Opinion
Rantz: Bob Ferguson shut off comments to avoid criticism after Dave Reichert attack ad
After attacking religious views around marriage, Bob Ferguson turned off his social media comments on X to avoid criticism.

Rantz: Is crime truly declining? Axios editorial is little more than Democrat politicking
A new Axios reports shows crime going down, at least with homicides. But the article is missing crucial context to understanding the issue.

Rantz: Seattle teacher Ian Golash put on administrative leave, father says
A man who says he's the father of Seattle teacher Ian Golash posted that his son was placed on administrative leave.
Podcasts
Listen to your favorite shows on your time.


MyNorthwest Traffic

Sullivan: I-405 expansion to widen freeway in Bothell is underway
We've all seen I-405 expanding between Bellevue and Redmond, but construction to widen the freeway north of Bothell is now underway as well.

I-5 repair work to slow spring breakers, baseball fans this weekend
Beginning Friday night, three lanes of I-5 north between Albro Place and the West Seattle Bridge through Monday morning at 5 a.m.

Has your insurance gone up? Rates can take a hike for distracted drivers
April is Distracted Drivers Awareness Month. The President of NW Insurance Council says it has been working on prevention for years.
MyNorthwest Weather

Buehner: Puget Sound Convergence Zone brings sunshine, showers, rainbows
Spring is here and with it comes the mix of sunny days and days with showers. Spring is also the peak time for the Puget Sound Convergence Zone.
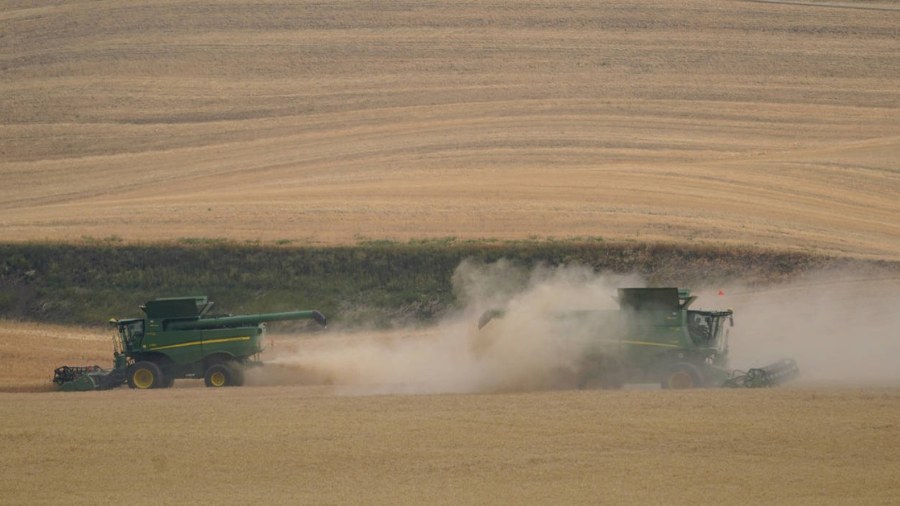
Washington remains in the grips of drought, will stay there
The State of Washington Department of Ecology this week declared a new drought declaration for most of the entire state.

Brace yourself for weeks of poor air quality in 2024, Seattle residents
Unfortunately, bad air quality will plague the Seattle area for three weeks this year. And the trend is projected to get worse.
MyNorthwest Politics
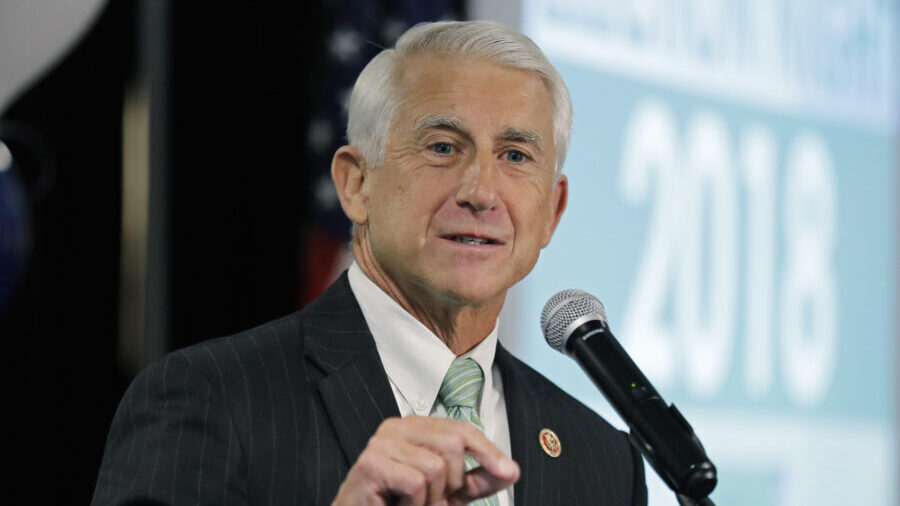
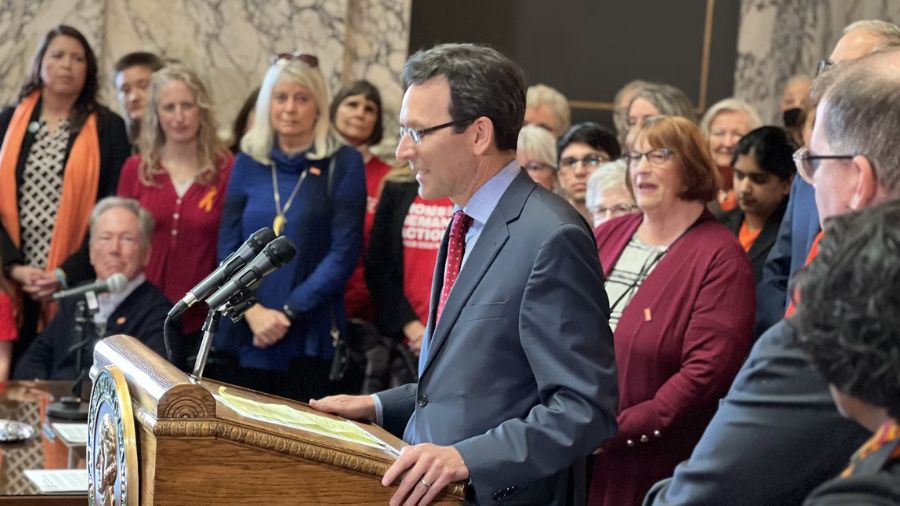
'I have my own personal beliefs:' Reichert speaks on same-sex marriage following Ferguson's post
Ferguson posted a video on X of Reichert telling a group of Pierce County Republicans that "marriage is between a man and a woman."

Senate dismisses two articles of impeachment against Homeland Security secretary, ends trial
The Senate dismissed impeachment charges against Homeland Security Secretary Alejandro Mayorkas, as Republicans pushed to remove him.

Rep. Maycumber threatens legal action against Loren Culp amid social media tirade
On Tuesday, Maycumber's office announced it sent a cease-and-desist letter to Loren Culp after a barrage of social media posts.
MyNorthwest Lifestyle

Bumbershoot producers unveil plans for new downtown Seattle arts venue
The brains behind the Bumbershoot Festival will launch a new arts venue in downtown Seattle at the old Bed, Bath, and Beyond.

Swiftie alert: Puyallup to celebrate next era of Taylor Swift
Taylor Swift is coming back for another era. Local Swifities are getting ready to celebrate her new album, "The Tortured Poets Department."

Toxic 'fake Botox' case linked to Washington
Federal officials are investigating reports of a fake Botox product that has reportedly sickened people across nine states, including Washington.
MyNorthwest History
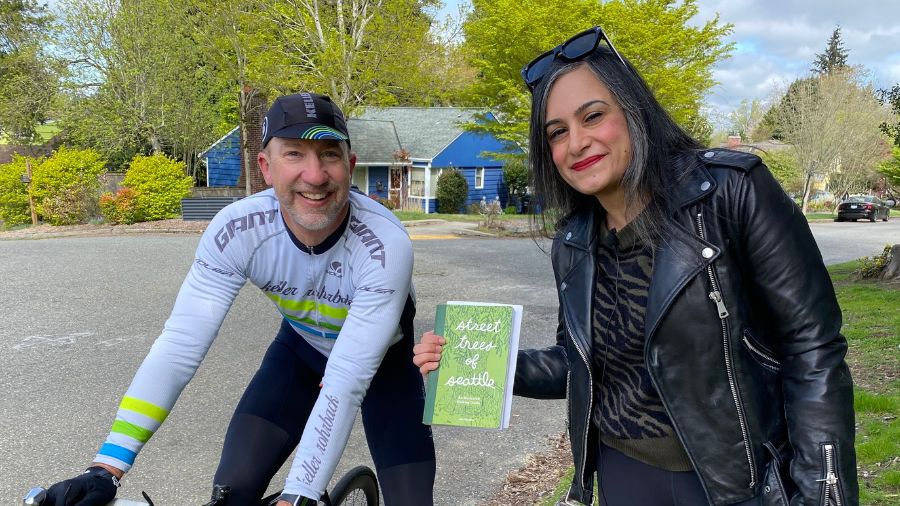
Layers of history revealed by 'Street Trees of Seattle'
This new book is “Street Trees of Seattle: An Illustrated Walking Guide” by writer and artist Taha Ebrahimi.

Update: Cold War air raid siren remains in private hands
A vintage magazine ad for the type of Cold War air-raid siren which stood in a Seattle park for more than 70 years, and which now belongs to Binford Metals in Kent. (Public domain)
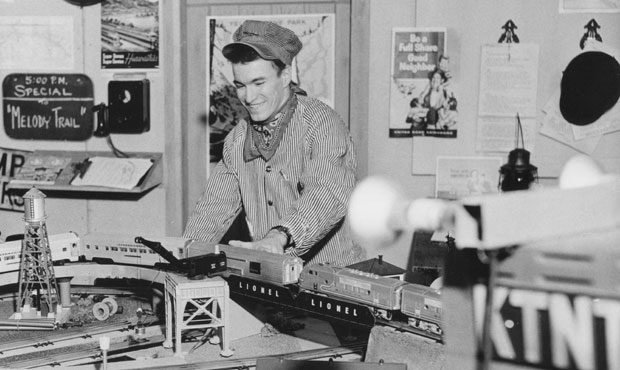
Local TV legend "Brakeman Bill" McLain passes away at age 96
Brakeman Bill McLain, longtime beloved kids' TV show host, has passed away, according to a message from his family posted on social media.
National News
Judge drops some charges against ex-Minnesota college student feared of plotting campus shooting
NORTHFIELD, Minn. (AP) — A judge has dismissed some of the most serious charges against a former Minnesota college student who police and prosecutors feared was plotting a campus shooting. Waylon Kurts, of Montpelier, Vermont, who was then a student at St. Olaf College in Northfield, was charged last April with conspiracy to commit second-degree […]
A man gets 19 years for a downtown St. Louis crash that cost a teen volleyball player her legs
ST. LOUIS (AP) — A St. Louis man has been sentenced to 19 years in prison for causing a downtown accident that resulted in the amputation of the legs of a teenage volleyball player from Tennessee. Daniel Riley, 22, was convicted last month of second-degree assault, armed criminal action, fourth-degree assault and driving without a […]
The Latest | Jury selection in Trump's hush money trial shifts to picking alternates
NEW YORK (AP) — Lawyers in former President Donald Trump ‘s hush money case shifted their attention Friday to picking alternates as jury selection resumed for a fourth day. The proceedings began again with the questionnaire phase of jury selection and 22 possible jurors were brought in. As many as five alternate jurors must be […]
Sponsored Articles
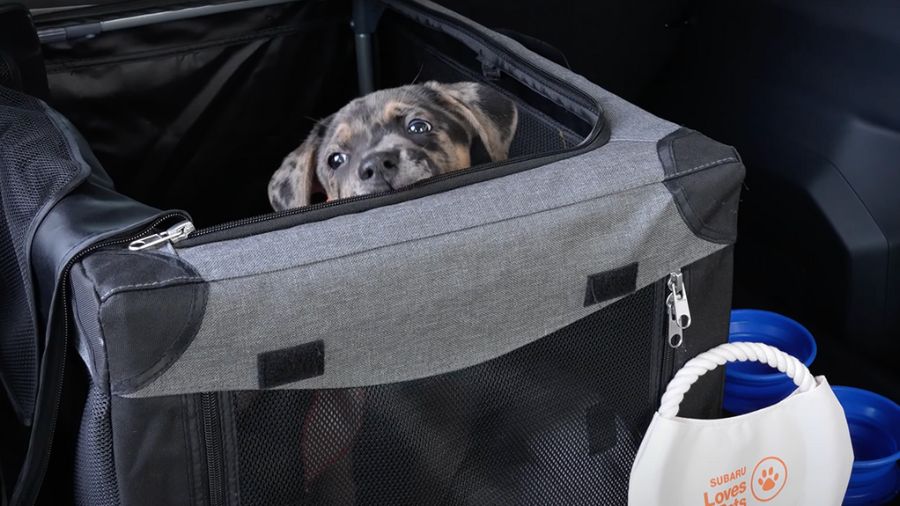
Ensuring pet safety on the road with Saving Great Animals, Carter Subaru
Saving Great Animals, along with Carter Subaru, outlined valuable tips to ensure four-legged family members are secure during car rides.

Discover MoPOP's new exhibit: 'Massive: The Power of Pop Culture'
The Museum of Pop Culture invites you to experience pop culture like never before with its new exhibition "Massive: The Power of Pop Culture."

Salk: A local credit union inspiring its community
In the heart of Kitsap County, a financial institution is making waves not just as a banking entity but as a beacon of community support.