
THE LATEST
-

Pierce County elementary school teacher arrested in connection to child molestation
-

Trader Joe’s recall: Salmonella found in basil
-
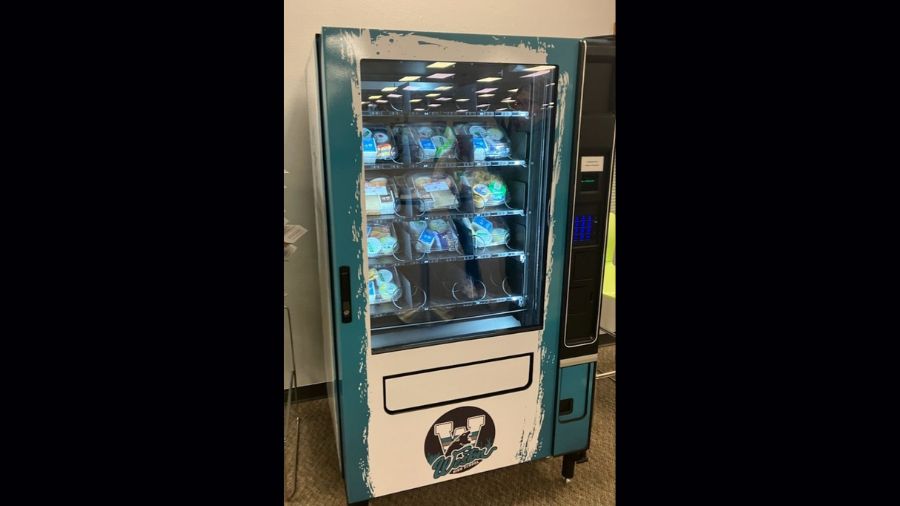
Arlington school breaks barriers one vending machine meal at a time
-

Seattle Mayor to address city’s arson problem in vacant buildings
-
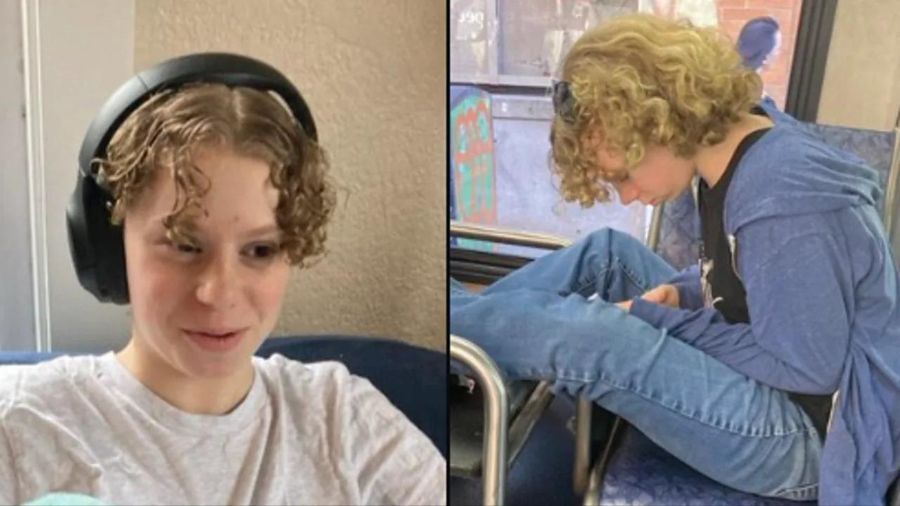
13-year-old Madison Valley girl missing since Tuesday
-
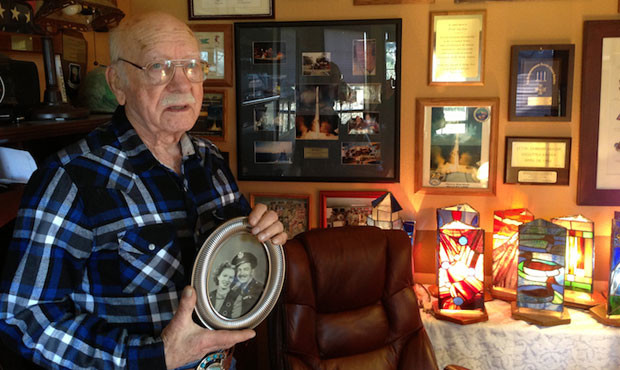
Remembering Enumclaw’s Doolittle Raider Edward Saylor
TOP STORIES
'What'd you say?': Starbucks attempts to tamp down the noise

-

MyNorthwest Weather
Buehner: Puget Sound Convergence Zone brings sunshine, showers, rainbows
-

KIRO Newsradio Opinion
Video of man getting knocked out, robbed in Seattle goes viral; Gee and Ursula respond
-

LISTEN NOW: LIVE RADIO


QUESTION OF THE DAY
MyNorthwest News
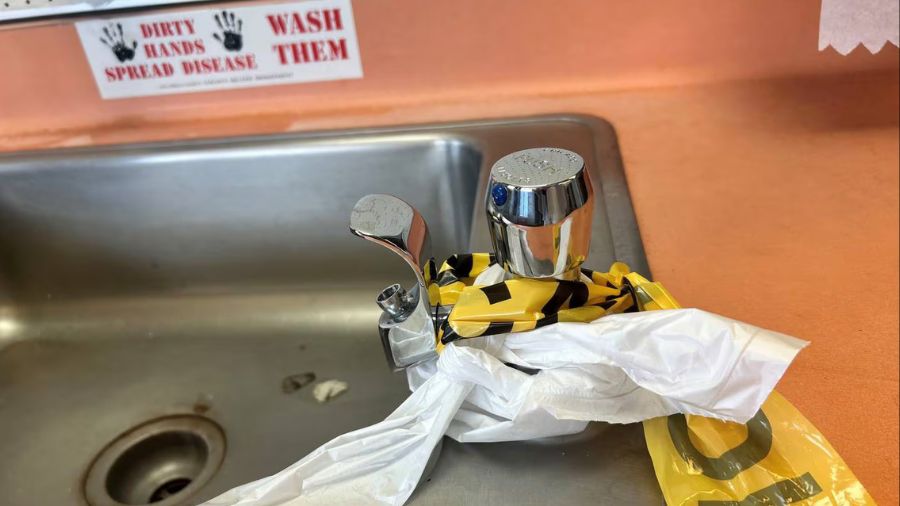
Two months of discolored water at Tacoma school leads to frustrated faculty and parents
Birney Elementary School in Tacoma has been dealing with brown, discolored water since February, with teachers and parents demanding answers.

UW football player pleads not guilty to raping mulitple women
18-year-old UW running back Tylin "Tybo" Rogers has been charged with one count of second-degree rape and another count of third-degree rape.

State commissioner to decide on high-capacity magazine ban
The Washington State Commissioner held a hearing on whether the ban on high-capacity magazines should be lifted while the full court considers the matter.
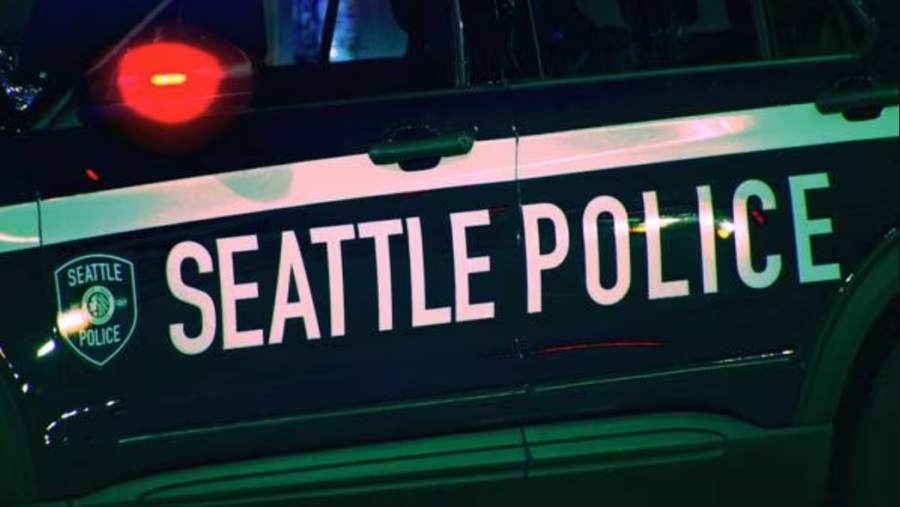
Seattle police kill man suspected of committing crimes against children, officer injured
A man suspected of committing crimes against children was killed by Seattle police inside a hotel in Tukwila Wednesday afternoon.
Whistleblower: Boeing involved in 'criminal cover-up'
A Boeing whistleblower testified before a U.S. Senate subcommittee claiming the company is involved in a "criminal cover-up."

Senate dismisses two articles of impeachment against Homeland Security secretary, ends trial
The Senate dismissed impeachment charges against Homeland Security Secretary Alejandro Mayorkas, as Republicans pushed to remove him.
SeattleSports.com

Bump: Why a Rashaad Penny reunion makes sense for Seahawks
The Seattle Seahawks reportedly met with free agent running back Rashaad Penny. Here's why it'd make sense for Seattle to bring him back.

Huard: Why UW QB Michael Penix Jr. should be in play for Seahawks
Brock Huard explains why the Seattle Seahawks should target UW Huskies QB Michael Penix Jr. if he's still available after the first round.

NHL: Arizona Coyotes are officially headed to Salt Lake City
The Arizona Coyotes are officially headed to Salt Lake City. The NHL Board of Governors voted unanimously Thursday to approve a sale to the Utah Jazz owners.

Reaction: Are Seahawks’ removals disrespecting their history?
Under new head coach Mike Macdonald, the Seattle Seahawks have removed some things at team HQ from the Pete Carroll era. Brock and Salk react.

Video: Booger McFarland on where former UW Huskies Fautanu and Penix will get drafted in the 2024 NFL Draft
Where does Booger McFarland think former Washington Huskies Troy Fautanu and Michael Penix Jr will get drafted in the 2024 NFL Draft? What impact might it have on the Seattle Seahawks plans for this draft and beyond? He joined Brock Huard and Mike Salk to talk about that and where these two potential stars might […]

Video: Brock Huard’s NFL Draft Profile: Michael Penix Jr, Quarterback – Washington
Today on Brock and Salk, Brock Huard looked at a potential fit for the Seattle Seahawks in the upcoming NFL Draft. Why does Brock think Washington QB Michael Penix Jr might be a offensive fit for the Seahawks? What else could he bring to this team other than QB depth? Why is he different from […]
KIRO Newsradio Opinion

Angela Poe Russell: O.J.'s death reminds America of its persistent judicial problem
Most people who stand accused, regardless of guilt or innocence, can’t afford O.J.'s dream team of attorneys, much less standard fees.

Gee and Ursula: Did pro-Palestinian protesters lose supporters by blocking traffic?
46 pro-Palestinian demonstrators were arrested after blocking the expressway leading to Sea–Tac. Gee Scott says that's when they lost him.

Stine: 'I gave a stranger on the internet money for bras'
My point is random acts of kindness, on the internet or not, keep our society functioning, and it can be for anyone, at any time.
KTTH Opinion
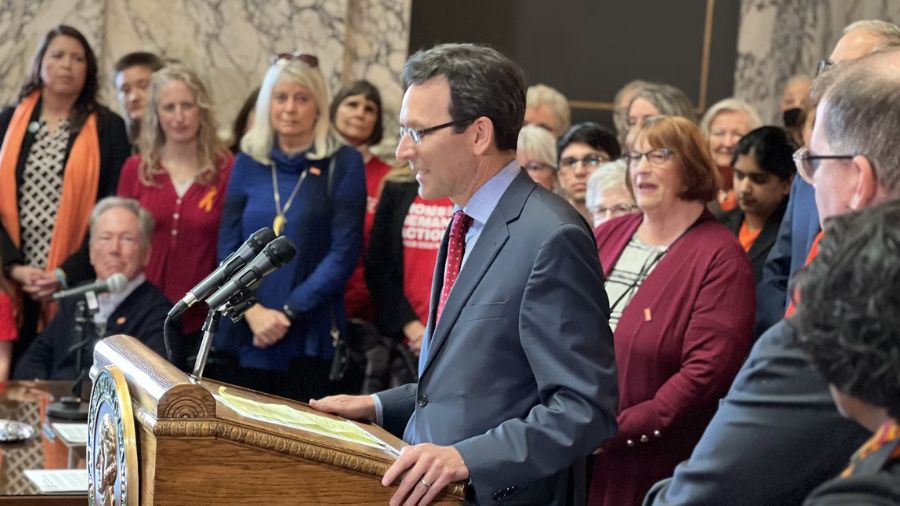
Rantz: Bob Ferguson shut off comments to avoid criticism after Dave Reichert attack ad
After attacking religious views around marriage, Bob Ferguson turned off his social media comments on X to avoid criticism.

Rantz: Is crime truly declining? Axios editorial is little more than Democrat politicking
A new Axios reports shows crime going down, at least with homicides. But the article is missing crucial context to understanding the issue.

Rantz: Seattle teacher Ian Golash put on administrative leave, father says
A man who says he's the father of Seattle teacher Ian Golash posted that his son was placed on administrative leave.
Podcasts
Listen to your favorite shows on your time.


MyNorthwest Traffic

Sullivan: I-405 expansion to widen freeway in Bothell is underway
We've all seen I-405 expanding between Bellevue and Redmond, but construction to widen the freeway north of Bothell is now underway as well.

I-5 repair work to slow spring breakers, baseball fans this weekend
Beginning Friday night, three lanes of I-5 north between Albro Place and the West Seattle Bridge through Monday morning at 5 a.m.

Has your insurance gone up? Rates can take a hike for distracted drivers
April is Distracted Drivers Awareness Month. The President of NW Insurance Council says it has been working on prevention for years.
MyNorthwest Weather
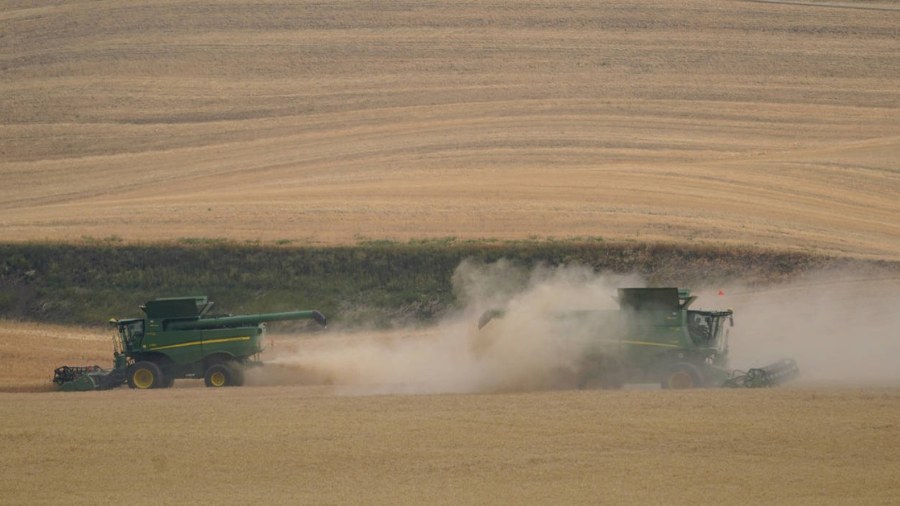
Washington remains in the grips of drought, will stay there
The State of Washington Department of Ecology this week declared a new drought declaration for most of the entire state.

Brace yourself for weeks of poor air quality in 2024, Seattle residents
Unfortunately, bad air quality will plague the Seattle area for three weeks this year. And the trend is projected to get worse.

This week's weather: April showers to bring May flowers
Perhaps these additional April showers will bring May flowers as the days continue to get longer. Monday will mark the year’s first 8 p.m. sunset.
MyNorthwest Politics
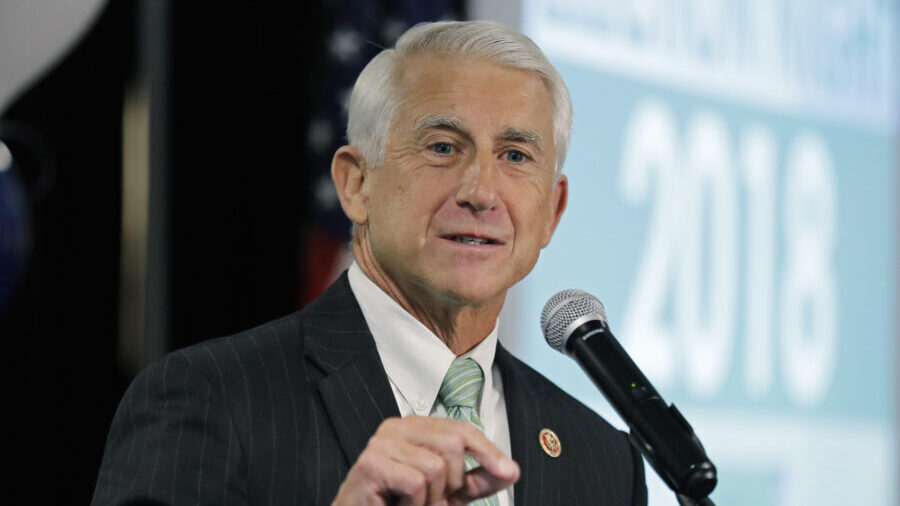
'I have my own personal beliefs:' Reichert speaks on same-sex marriage following Ferguson's post
Ferguson posted a video on X of Reichert telling a group of Pierce County Republicans that "marriage is between a man and a woman."
Senate dismisses two articles of impeachment against Homeland Security secretary, ends trial
The Senate dismissed impeachment charges against Homeland Security Secretary Alejandro Mayorkas, as Republicans pushed to remove him.

Rep. Maycumber threatens legal action against Loren Culp amid social media tirade
On Tuesday, Maycumber's office announced it sent a cease-and-desist letter to Loren Culp after a barrage of social media posts.
MyNorthwest Lifestyle

Bumbershoot producers unveil plans for new downtown Seattle arts venue
The brains behind the Bumbershoot Festival will launch a new arts venue in downtown Seattle at the old Bed, Bath, and Beyond.

Swiftie alert: Puyallup to celebrate next era of Taylor Swift
Taylor Swift is coming back for another era. Local Swifities are getting ready to celebrate her new album, "The Tortured Poets Department."

Toxic 'fake Botox' case linked to Washington
Federal officials are investigating reports of a fake Botox product that has reportedly sickened people across nine states, including Washington.
MyNorthwest History
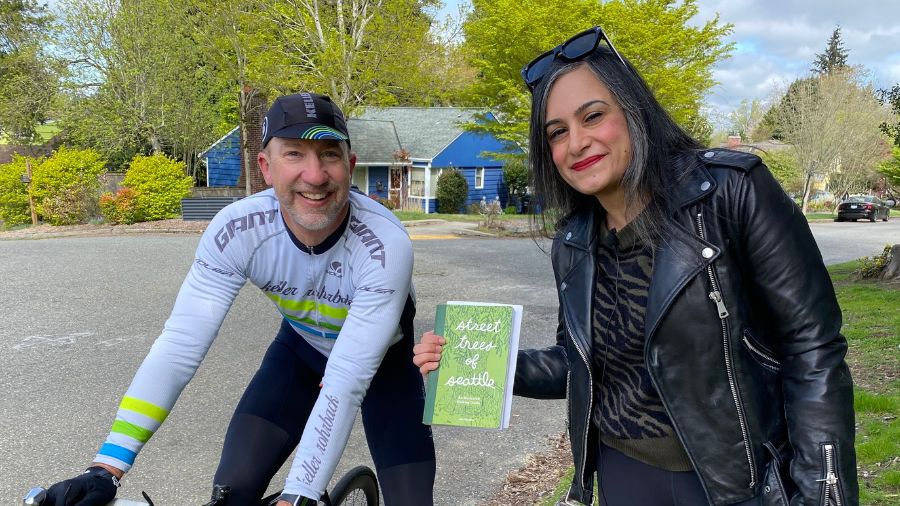
Layers of history revealed by 'Street Trees of Seattle'
This new book is “Street Trees of Seattle: An Illustrated Walking Guide” by writer and artist Taha Ebrahimi.

Update: Cold War air raid siren remains in private hands
A vintage magazine ad for the type of Cold War air-raid siren which stood in a Seattle park for more than 70 years, and which now belongs to Binford Metals in Kent. (Public domain)
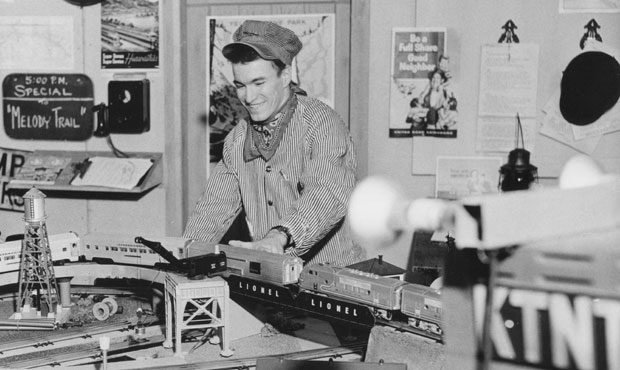
Local TV legend "Brakeman Bill" McLain passes away at age 96
Brakeman Bill McLain, longtime beloved kids' TV show host, has passed away, according to a message from his family posted on social media.
National News
Legislation allowing doctor-assisted suicide narrowly clears Delaware House, heads to state Senate
DOVER, Del. (AP) — A bill allowing doctor-assisted suicide in Delaware narrowly cleared the Democrat-led House on Thursday and now goes to the state Senate for consideration. The bill is the latest iteration of legislation that has been repeatedly introduced by Newark Democrat Paul Baumbach since 2015, and it is the only proposal to make […]
California governor pledges state oversight for cities, counties lagging on solving homelessness
SAN FRANCISCO (AP) — Nearly $200 million in grant money will go to California cities and counties to move homeless people from encampments into housing, Gov. Gavin Newsom announced Thursday while also pledging increased oversight of efforts by local governments to reduce homelessness. The Democratic governor said he will move 22 state personnel from a […]
More human remains believed those of missing woman wash up on beach
SOUTH MILWAUKEE (AP) — More human remains, including a torso, that are believed to belong to a missing woman have washed up on a beach along Lake Michigan, authorities said Thursday. The torso and an arm believed to belong to 19-year-old Sade Robinson were found Thursday morning along a remote stretch of tree-lined beach in […]
Sponsored Articles
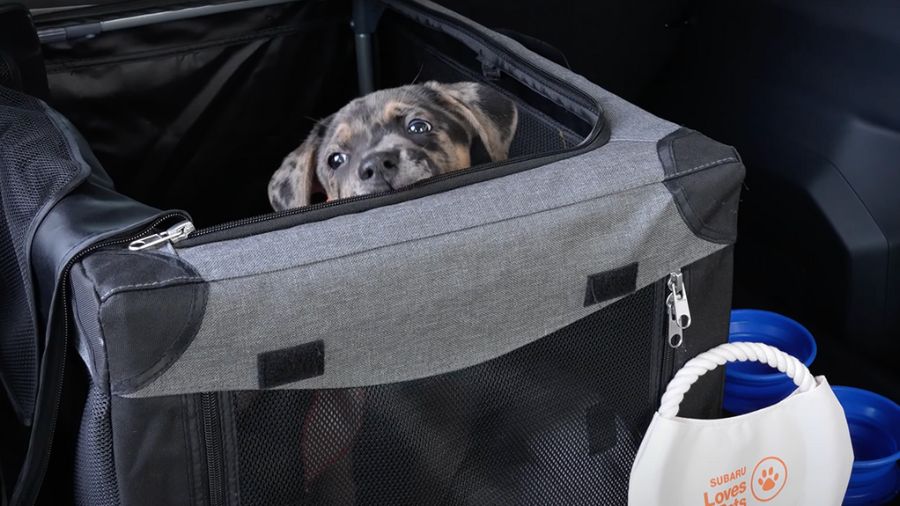
Ensuring pet safety on the road with Saving Great Animals, Carter Subaru
Saving Great Animals, along with Carter Subaru, outlined valuable tips to ensure four-legged family members are secure during car rides.

Discover MoPOP's new exhibit: 'Massive: The Power of Pop Culture'
The Museum of Pop Culture invites you to experience pop culture like never before with its new exhibition "Massive: The Power of Pop Culture."
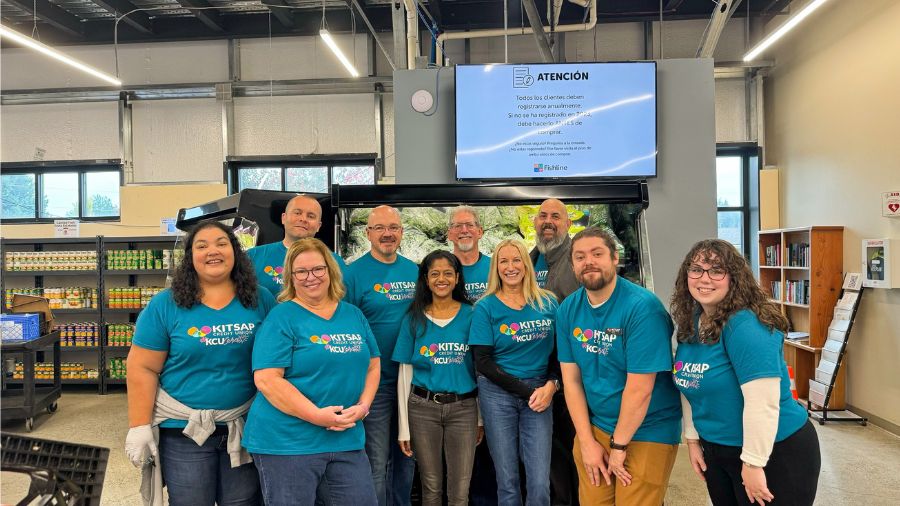
Salk: A local credit union inspiring its community
In the heart of Kitsap County, a financial institution is making waves not just as a banking entity but as a beacon of community support.