
THE LATEST
-

Supreme Court appears skeptical that state abortion bans conflict with federal health care law
-

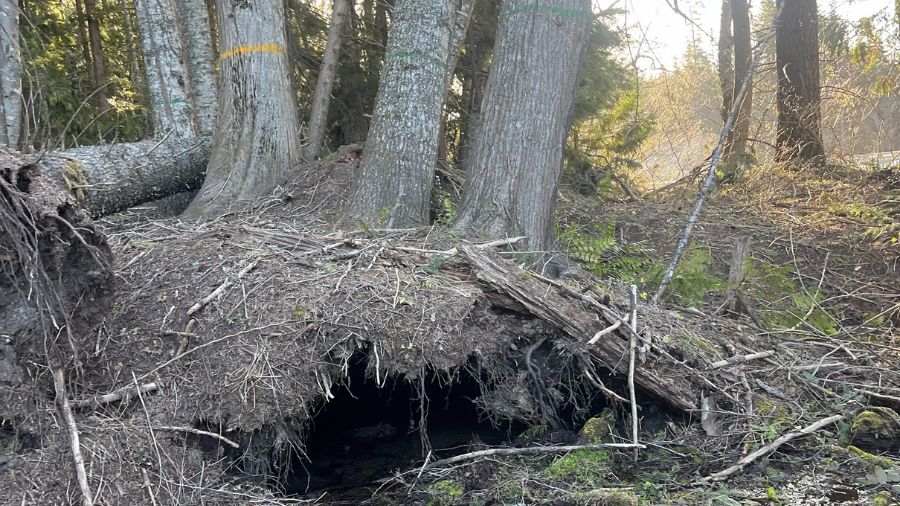
Snohomish County Search and Rescue seeks volunteers amid uptick in missions
-
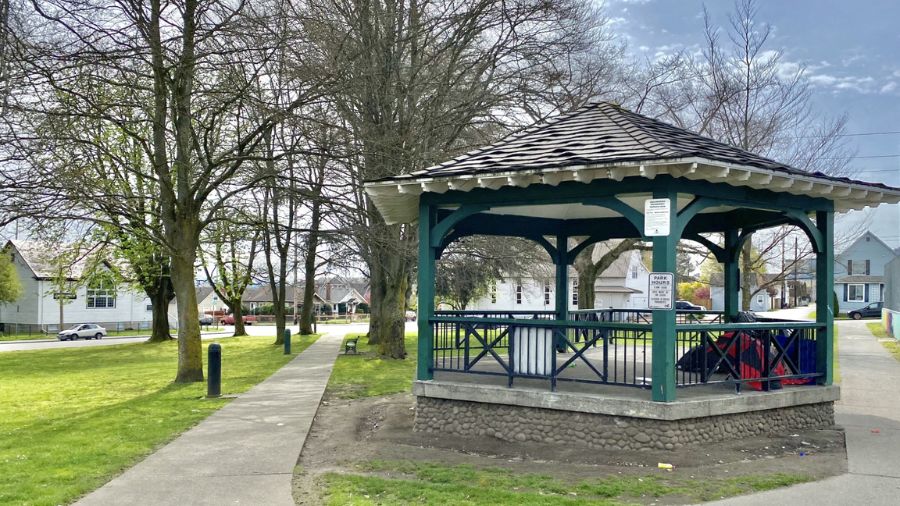
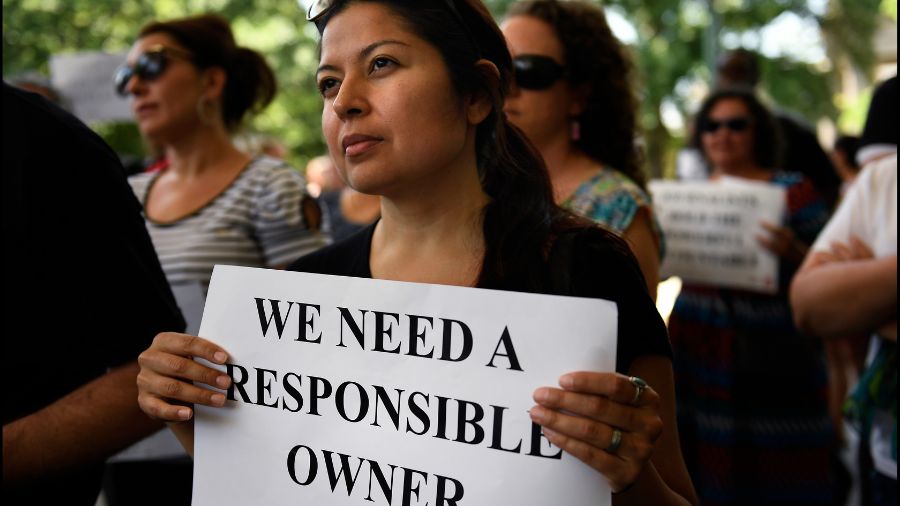
Citizens beg City of Everett to compromise on dog park and gazebo
-
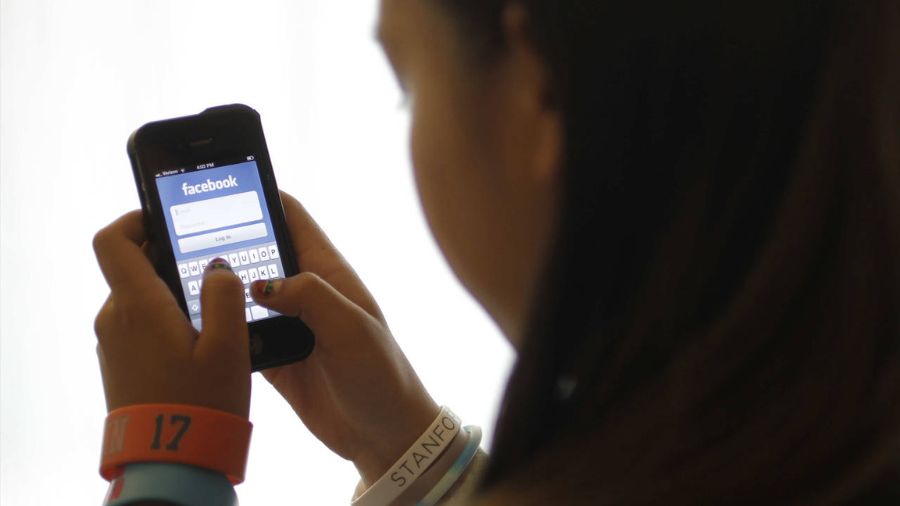
Sextortion is trapping our teens but one major company is working to stop it
-
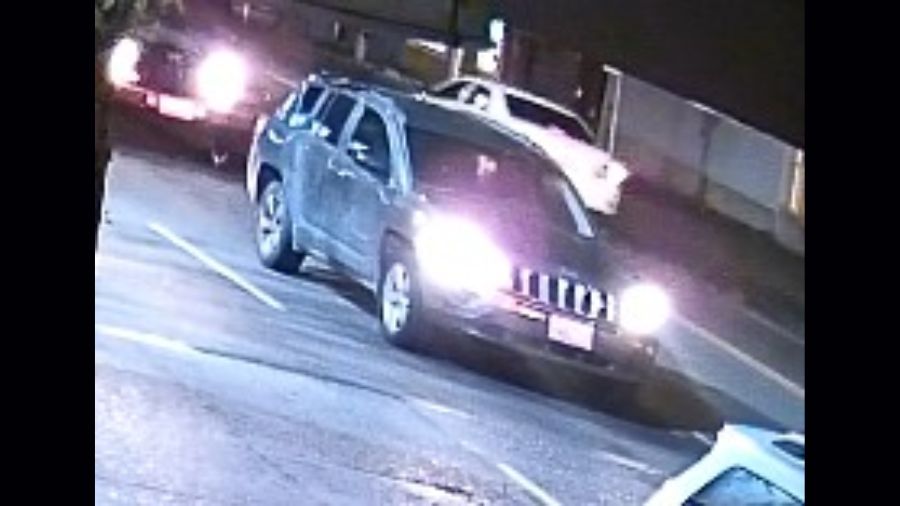
King County deputies searching for suspected hit-and-run jeep
-

Biden signs $95B war aid measure for Ukraine, Israel, Taiwan into law as TikTok faces ban


LISTEN NOW: LIVE RADIO


QUESTION OF THE DAY
MyNorthwest News
More freedom for Washington workers as noncompete contracts are challenged
The Federal Trade Commission has swung its regulatory hammer, striking down nearly all non-compete agreements.
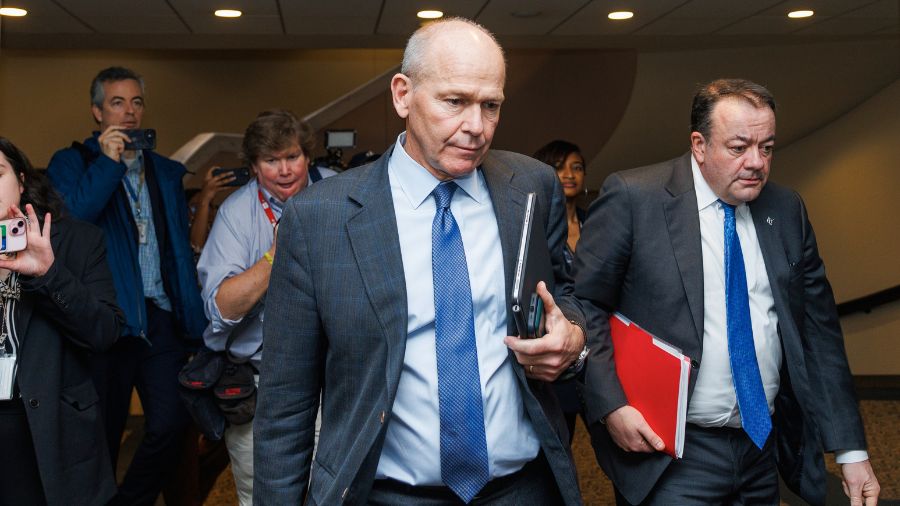
Boeing posts $355 million loss in Q1 after series of company crises
"We are in a tough moment," Boeing CEO David Calhoun said as the company announced a $355 million loss in 2024's Q1.

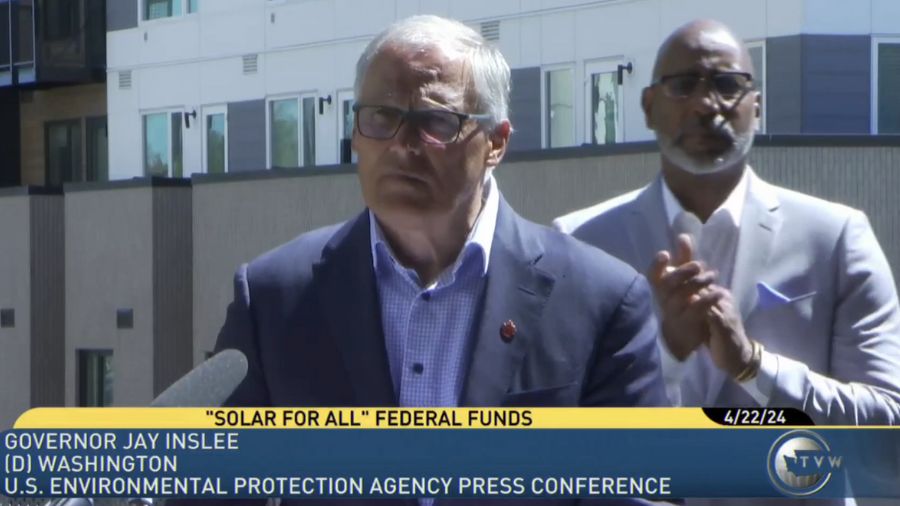
Washington receives over $150M to implement solar, lower energy costs
On Monday, The EPA announced Washington has been selected to get $156M to develop long-lasting solar programs for low-income communities.

The Letter Season 2: Sense of dread precedes second 1982 Millcreek Canyon murder
The second episode of the second season of The Letter, "Ripple Effect," details the second man killed in a 1982 double murder.
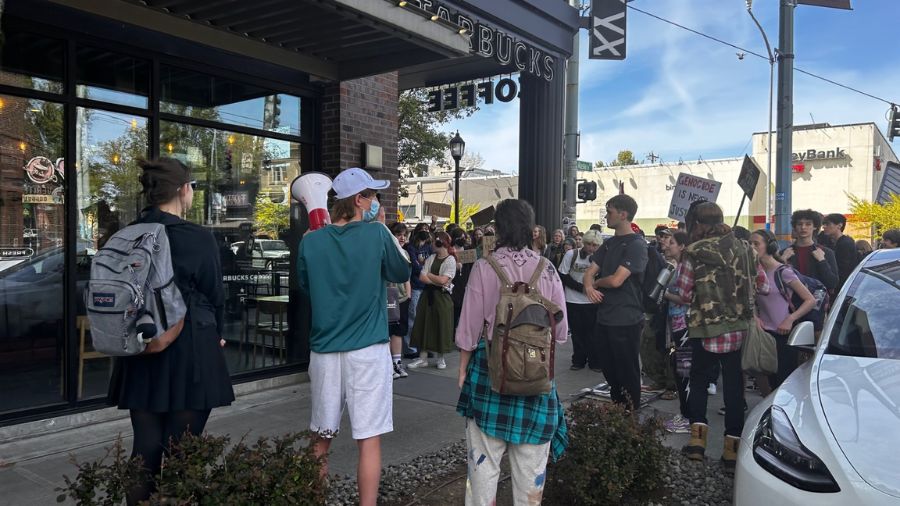
Western Washington students walk out against Israel-Hamas war
Around 100 West Seattle High School students joined other groups across the nation in protesting against the Israel-Hamas war.

Boeing engineers allege retaliation over safety concerns
Two Boeing engineers have alleged retaliation by the company’s management after they insisted on a re-evaluation of work on the 787 and 777.
SeattleSports.com

Ranked: Brock’s top 5 UW Huskies in 2024 NFL Draft
Ex-UW Huskies quarterback Brock Huard ranks his top-five players from his alma mater heading into the 2024 NFL Draft.

Video: What has been the biggest factor in the Mariners turnaround? Bob’s Baseball Breakdown for 4-24-24
Bob Stelton of Seattle Sports’ Wyman and Bob breaks down the state of the Seattle Mariners. With Opening Week in the rear view mirror, what did he see this week? What has been the most positive part to this best stretch of the season? This week, Bob answers: – What has been the biggest factor […]
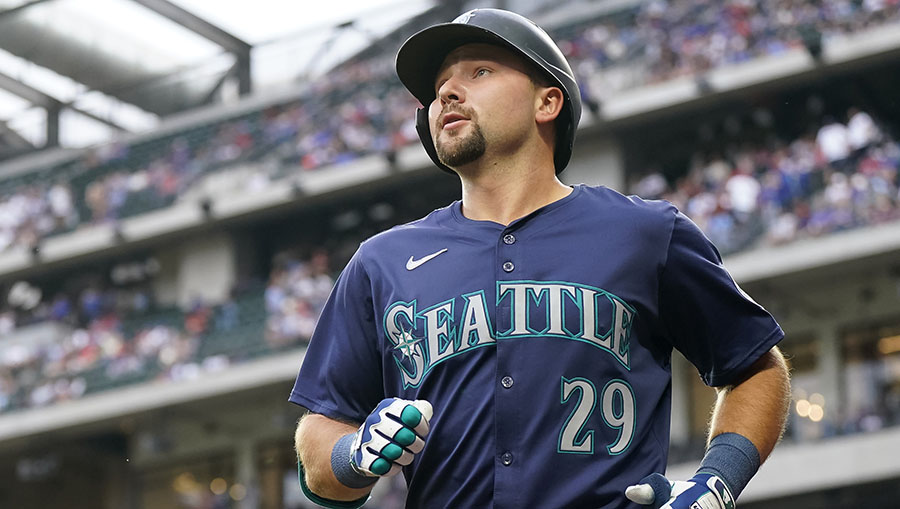
Mariners’ Raleigh, Crawford out of lineup — here’s why
Seattle Mariners catcher Cal Raleigh is out of Wednesday's lineup after having oral surgery to fix a broken tooth.

Video: One position group the Seattle Seahawks could Draft this year to help out in the near future
What is one position group the Seattle Seahawks could Draft this year to help out in the near future? Why do Wyman and Bob think it might be time to address it now before it becomes an issue? They discussed that and just what it means to the future of this team and their success. […]
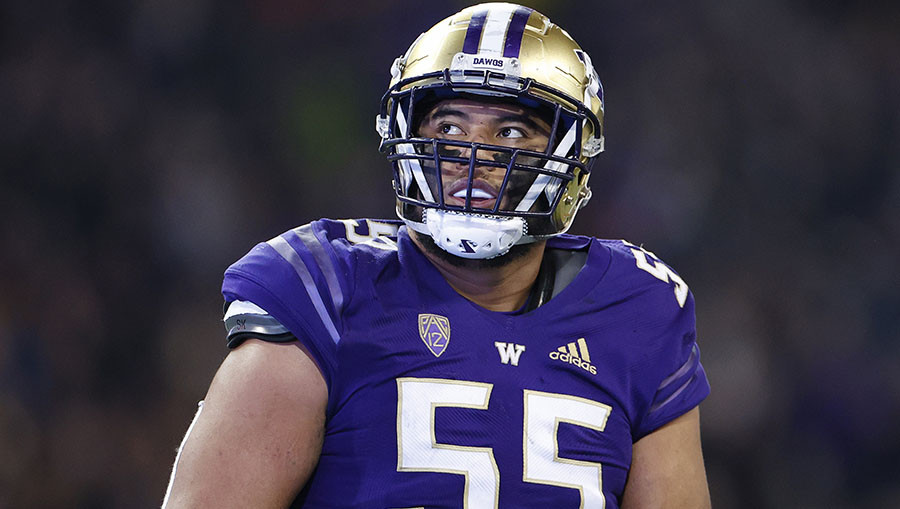
Brock’s Draft Profile: The perfect match for Seahawks? Troy Fautanu
College football analyst Brock Huard examines UW Huskies standout OL Troy Fautanu as a fit for the Seattle Seahawks.
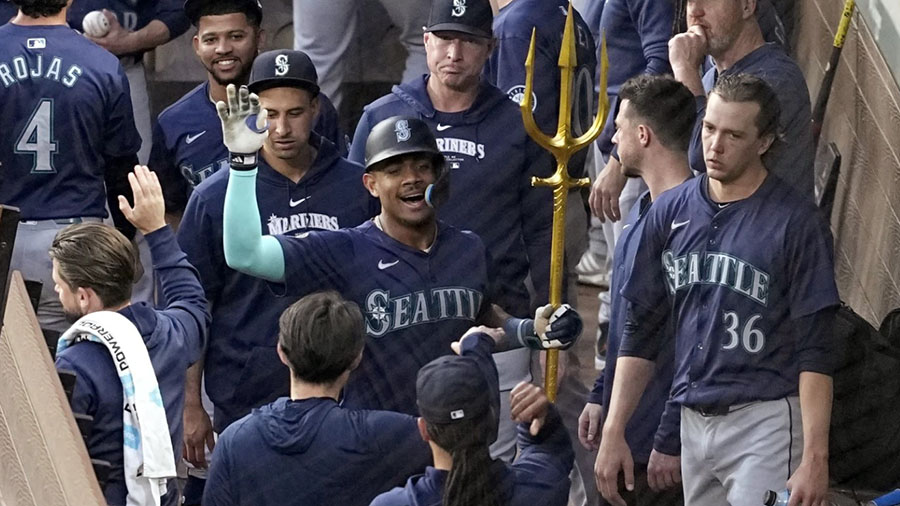
Julio Rodríguez reunites with an old friend: Mariners’ HR trident
Julio Rodríguez tightly hugged the trident that the Seattle Mariners use to celebrate home runs. It was a happy reunion, the first time the young slugger got to hold it after going deep this season.
KIRO Newsradio Opinion
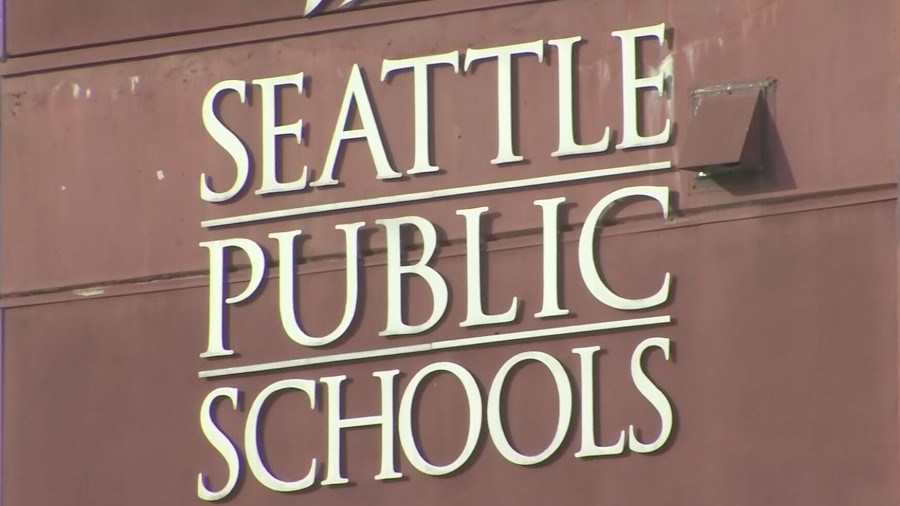
Angela Poe Russell: Some free answers for Seattle Schools' $100,000 question
Seattle Public Schools has lost 4,000 students in the last five years as kids poured into private schools and other alternative programs.
Markovich: Elected officials need accountability for their 'generosity' with our tax dollars
When King County dug into its pocket and pulled out $2 million to help dozens of asylum seekers and refugees in Tukwila -- I took a pause.

Spike O'Neill: Why Seattle's new art space won't work
I can't help but think about the announcement of the new art space designated to inhabit the old Bed Bath and Beyond in downtown Seattle.
KTTH Opinion
Rantz: Drama! Governor Jay Inslee slams Bob Ferguson's 'brain dead' ferry plan
What does Governor Jay Inslee think about Bob Ferguson's stolen ferry plan? He called it "brain dead." Did he do this on purpose?

Rantz: Seattle-area students to stage hate rally Tuesday as antisemitism on campus surges
Seattle-area students are holding antisemitic events throughout the state. Parents expect rally after rally to espouse antisemitism.

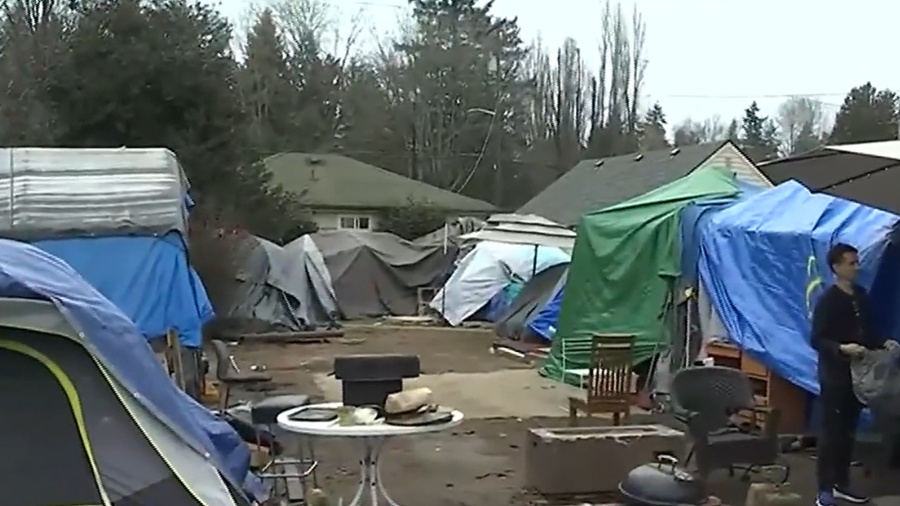
Rantz: United States Supreme Court could save Seattle from homeless crisis
The U.S. Supreme Court will hear a major case around homeless camping bans. It could finally end the progressive policy grip on Seattle.
Podcasts
Listen to your favorite shows on your time.


MyNorthwest Traffic
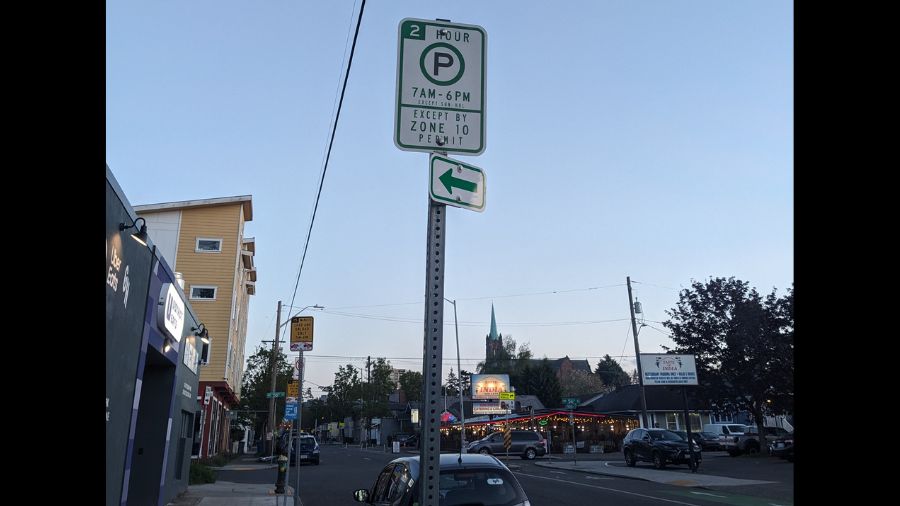
Sullivan: A guide to Restricted Parking Zones for any confused drivers
Deciphering the language on some parking signs can be difficult, and I am here to answer any questions regarding Restricted Parking Zones.
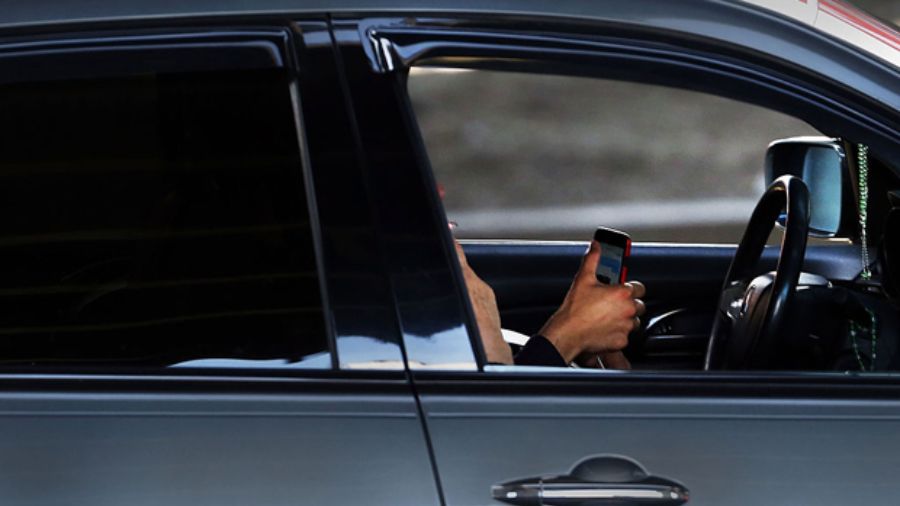
AAA: Washington is one of the worst states for distracted driving
April is Distracted Driving Awareness Month and to to shine a light on the subject, AAA Washington has teamed up with Safe Drive Club.
I-90 reopens after a closure due to an emergency tree removal
I-90 reopened after needing to close Friday afternoon due to an emergency tree removal, the Washington State of Transportation said Friday.
MyNorthwest Weather
Will a 'Heat Dome' be part of the upcoming Seattle summer?
The National Weather Service sees a possible 'Heat Dome' coming to Seattle this summer with high temperatures possible.

Buehner: This week's weather includes meteor showers, a pink moon, near-70 degree days
The Lyrid meteor shower that peaked over the past weekend but will continue Monday night before fading as April ends.

Buehner: What led to Washington drought as wildfires, rainbows on the horizon
DOE declared a Washington drought emergency. History shows below-average precipitation years often create more wildfires and wildfire smoke.
MyNorthwest Politics
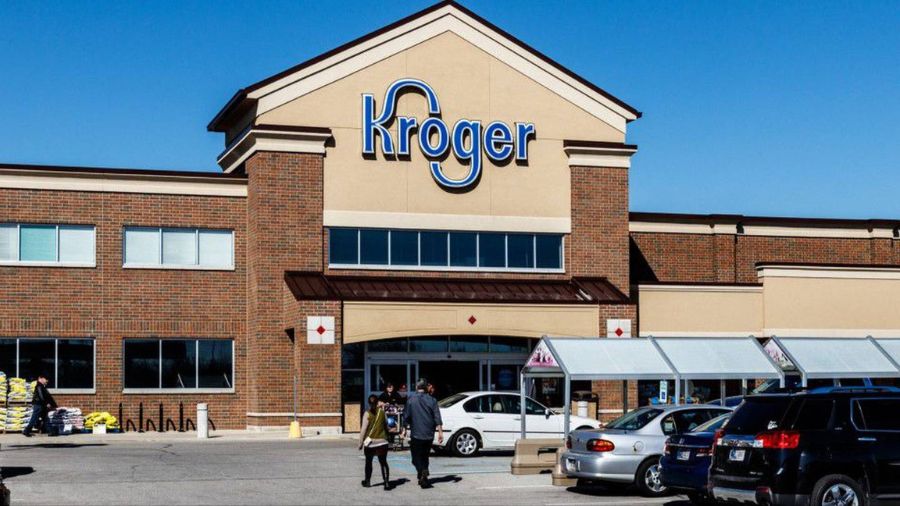
Kroger to pay nearly $50M to Washington to combat fentanyl crisis
Kroger is sending Washington $47.5 million to combat the fentanyl epidemic in an agreed-upon pending resolution championed by Attorney General Bob Ferguson.
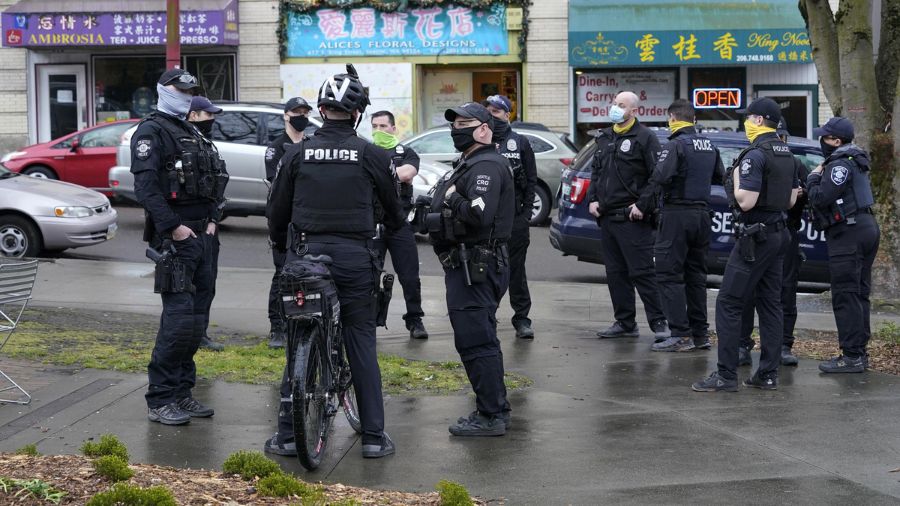
'SPD is dying': What Seattle police officers are saying during exit interviews
When asked what had a negative effect on morale in their exit interviews, Seattle police officers were nearly united in their responses.
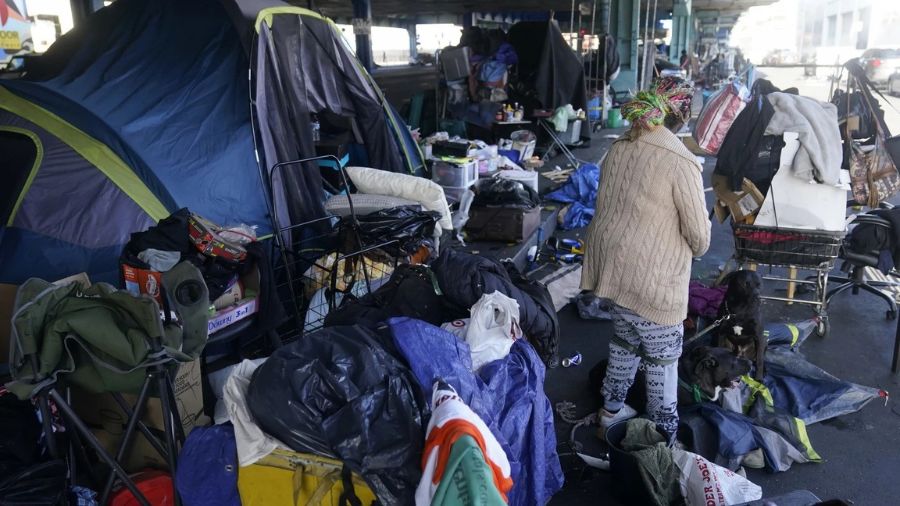
As homelessness rises, Supreme Court takes Oregon case, to decide on sleeping bans
The Supreme Court will rule on if banning homeless people from sleeping outside when there's no shelter space is cruel and unusual.
MyNorthwest Lifestyle

Colleen O'Brien: Seattle's new walkability maps
If you've ever vacationed in a city where you are within a 15-minute walk of whatever you may need, then you know how awesome it can feel.

Weekend revelry roundup: Record Day, Tay-Tay laser show, riding the bulls
A big weekend is on the way, and there will be a plethora of events to choose from, from laser shows to bull riding.

Butler: Pearl Jam's Dark Matter among the band's 'best, most cohesive records'
Vedder thinks "Dark Matter" is Pearl Jam's best work. You may or may not agree, but it's certainly one of their best and most cohesive records.
MyNorthwest History
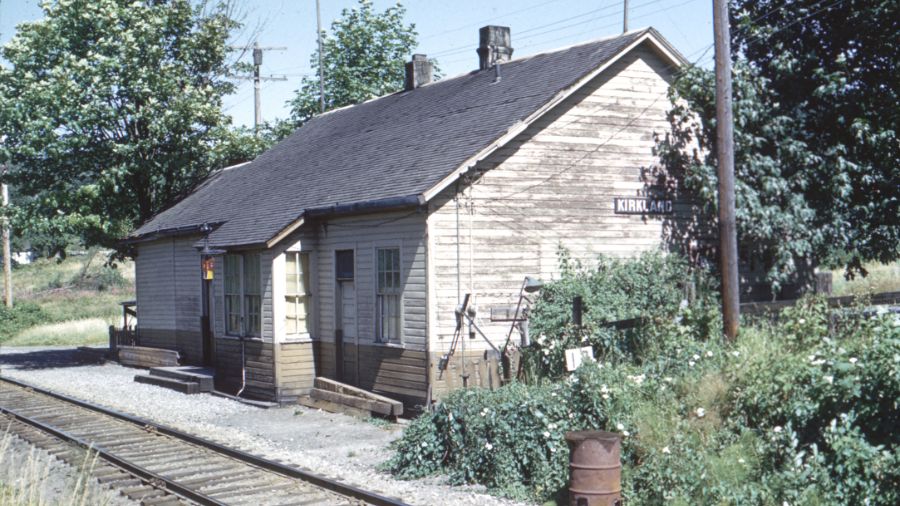
Echoes of Eastside rail history with Sound Transit preparing to get underway
As Sound Transit inaugurates commuter trains between Bellevue and Redmond, when was the last time passenger rail service was offered on the Eastside?
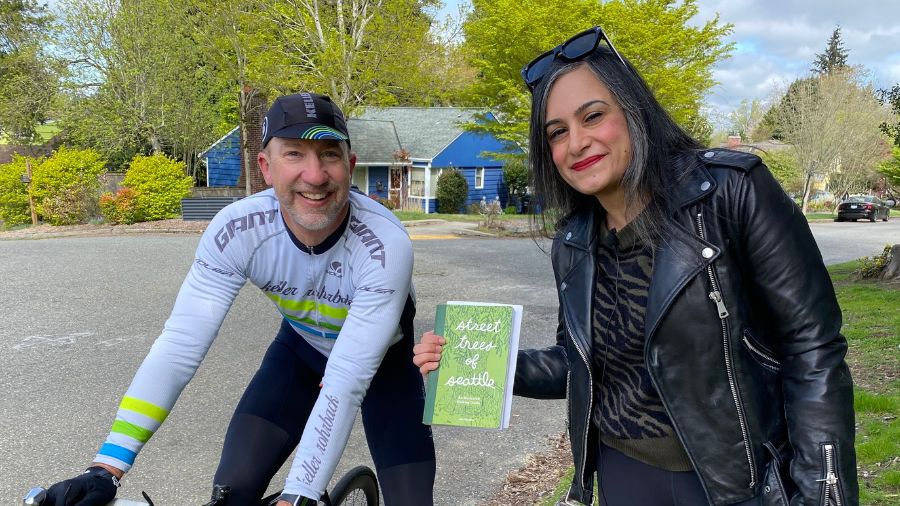
Layers of history revealed by 'Street Trees of Seattle'
This new book is “Street Trees of Seattle: An Illustrated Walking Guide” by writer and artist Taha Ebrahimi.

Update: Cold War air raid siren remains in private hands
A vintage magazine ad for the type of Cold War air-raid siren which stood in a Seattle park for more than 70 years, and which now belongs to Binford Metals in Kent. (Public domain)
National News
Instagram fraudster 'Jay Mazini' has been sentenced for his crypto scheme that preyed on Muslims
NEW YORK (AP) — The former Instagram influencer known as “ swindled millions of dollars from online followers and a network of Muslims during the pandemic was sentenced to seven years in prison on Wednesday, prosecutors said. Jebara Igbara, 28, of New Jersey, had pleaded guilty to fraud charges, admitting that he created a Ponzi […]
Connecticut Senate passes wide-ranging bill to regulate AI. But its fate remains uncertain
HARTFORD (AP) — The Connecticut Senate pressed ahead Wednesday with one of the first major legislative proposals in the U.S. to reign in bias in artificial intelligence decision-making and protect people from harm, including manufactured videos or deepfakes. The vote was held despite concerns the bill might stifle innovation, become a burden for small businesses […]
Judge orders anonymous jury for trial of self-exiled Chinese businessman, citing his past acts
NEW YORK (AP) — A self-exiled Chinese businessman is set to face an anonymous jury at his trial next month on fraud charges after a judge on Wednesday cited his past willingness to tamper with judicial proceedings as reason for concern. Guo Wengui goes to trial May 22 in Manhattan federal court, where jurors will […]
Sponsored Articles
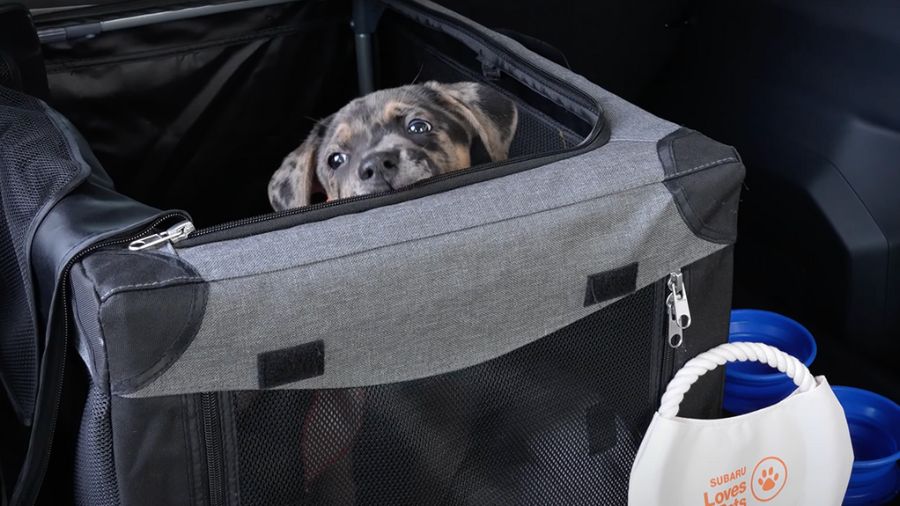
Ensuring pet safety on the road with Saving Great Animals, Carter Subaru
Saving Great Animals, along with Carter Subaru, outlined valuable tips to ensure four-legged family members are secure during car rides.

Discover MoPOP's new exhibit: 'Massive: The Power of Pop Culture'
The Museum of Pop Culture invites you to experience pop culture like never before with its new exhibition "Massive: The Power of Pop Culture."
Salk: A local credit union inspiring its community
In the heart of Kitsap County, a financial institution is making waves not just as a banking entity but as a beacon of community support.